Feltron gathered a wide range of data to create his Feltron Reports. The reports were furnished with data he collected from his everyday life and each set of data was presented by visualizations, such as lists, graphs, or charts. Feltron also wanted to use such visualizations to have “the simplest way to communicate the data” he has gathered. (1) Basically, Feltron wanted to present his data in the simplest form first and to show the details later. After viewing the Feltron Reports, I was able to find that Feltron improved the visualizations he used over the years to present his data in the simplest form. An example of these improvements occurred in the reports from 2005-2007.
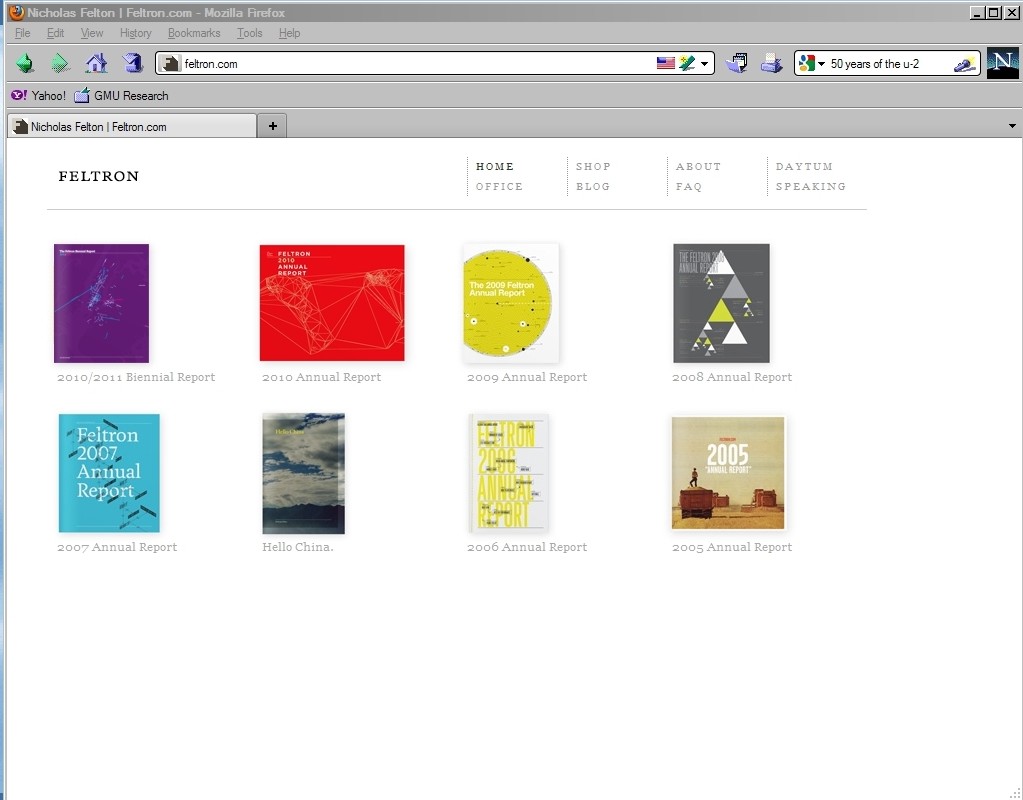
Snapshot of the Feltron Report website as of Oct 2012
One improvement in the reports from 2005-2007 was how the data for the “most played music artists” was presented. In 2005, the data was represented in a list form, while in 2006 and 2007 the data was represented in a pie chart. Though it may not be as easy as reading the list, the pie chart was an improvement of the list because it was able to show a comparison of how much each artist was played during the year.
Another visualization improvement was how the books and magazines Feltron read were presented. For books read, it was presented as a list in the 2005 and 2006 reports. In 2007, the visualization is simplified by using a number to represent the data on books read. This was an improvement as it then become easier for one to see a number than a list of book names to know how many were read.
One more improvement in the reports was the presentation of data for the photographs Feltron took based on location. The 2005 report used a traditional bar graph to present the data, while the 2006 and 2007 reports used a variation of the side bar graph. I found this to be an improvement as the side bar was able to clearly present the data from multiple locations on one bar (rather than on multiple bars in a traditional bar graph).
So, over the years Feltron was able to simplify the visualizations he used to present his data. The simpler visualizations helped him communicate his data quicker, easier, and help compliment the overall design of the reports.
——-