Feed on
Posts
Comments

Category Archive for 'Uncategorized'

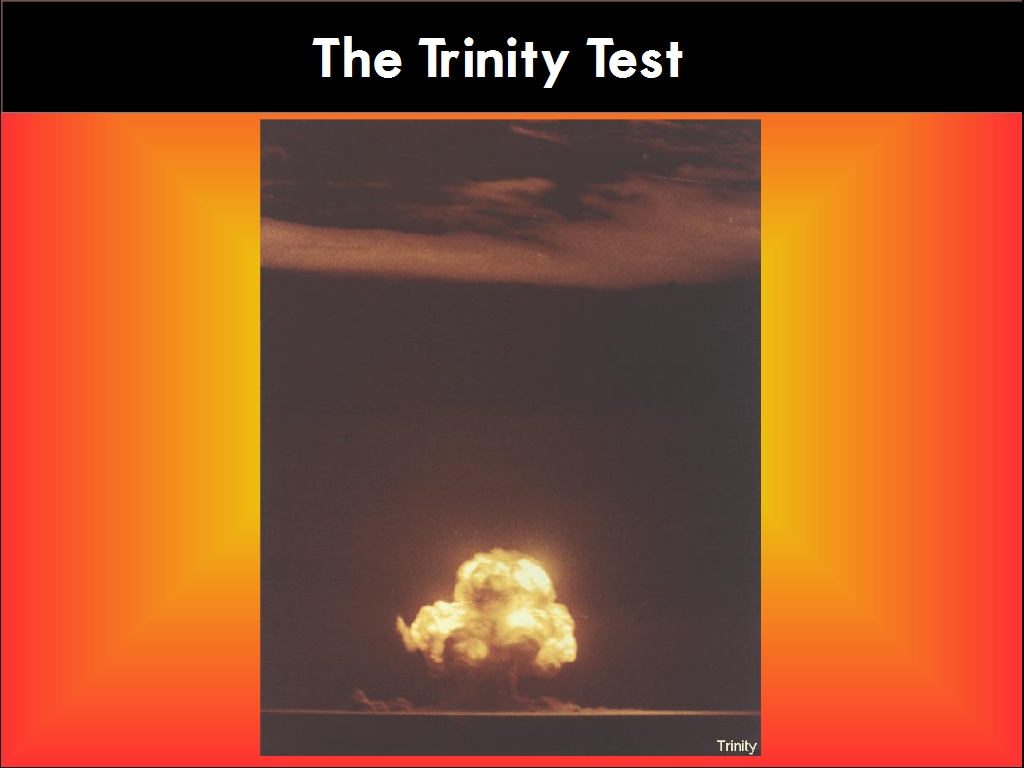
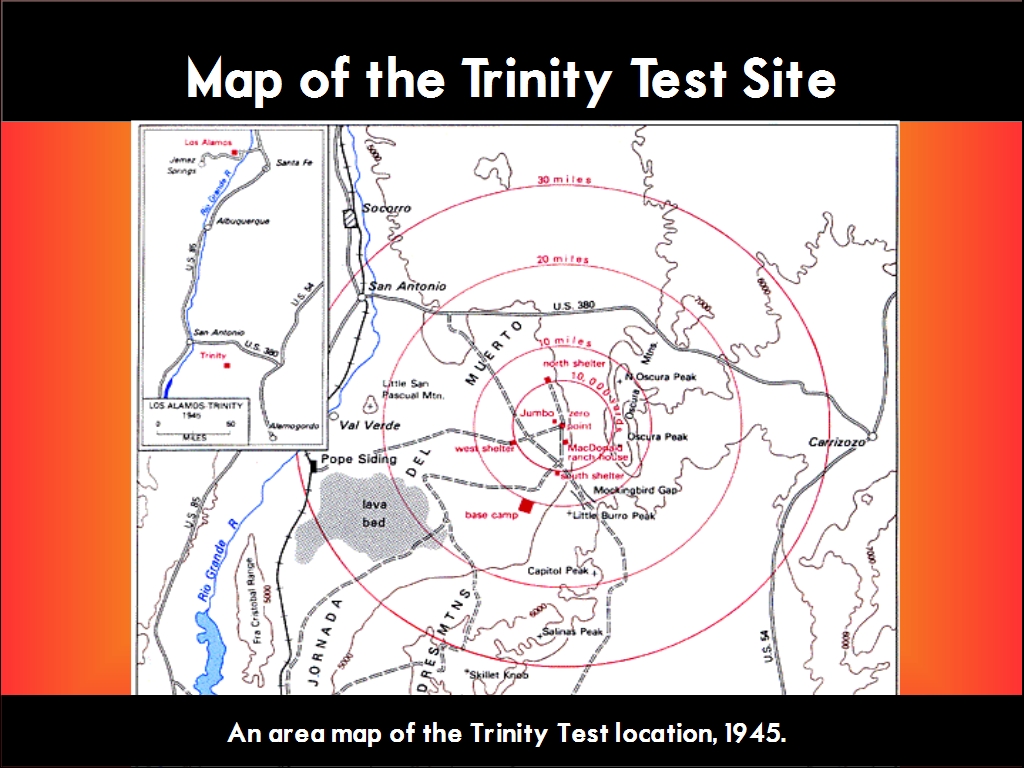
July 16, 1945 marked the day the United States detonated the world’s first nuclear weapon in the Trinity Test. In August 1945, the United States dropped two more nuclear weapons on Japan, ending World War II. The possession and the use of nuclear weapons propelled the U.S. to become a world superpower. But as it entered the Cold War with the Soviet Union, the U.S. needed to protect its people and allies against the spread of communism and nuclear weapons were a strategy to help protect U.S. interests. In 1946, the U.S. government embarked on a program to test nuclear weapons to understand their effects on structures, animals, the environment, and to discover its potential. Many U.S. nuclear tests were conducted in what is today the Republic of the Marshall Islands. In conducting these test, the U.S. government intended to better understand the capabilities of nuclear weapons in order protect themselves against the Soviet Union and maintain world peace. But the U.S. Nuclear Test Program actually caused more harm than good, especially to the people of the Marshall Islands.

President Harry S. Truman made two statements about the use of nuclear weapons during World War II. The first statement (called the August Statement from here on) was made on Aug. 6, 1945, the same day the nuclear bomb Little Boy was dropped on Hiroshima. Truman talked about the amount of man-power and resources used to develop the bomb and that the United States had the power to influence and maintain world peace. (1) The second statement (called the October Statement from this point forward) was made on Oct. 3, 1945, two months after the nuclear bombings on Hiroshima and Nagasaki. In this statement, Truman made a proposal to Congress to develop a commission to ensure the proper control of nuclear weapons at home and abroad, and to ensure their future use for peaceful purposes. (2) Using Wordle, a web application that creates word clouds to emphasize the words most frequently used in a text, I found that the most frequently used words in Truman’s statements reflected what was to become of the U.S. Nuclear Test Program. In the October Statement, the words that were used frequently were: Development, Research, Use, Control and Discovery. [Fig. 1] The October Statement reflected what the U.S. government wanted to ultimately do with Nuclear Test Program. These words expressed their desire to develop nuclear weapons in order to study their effects and to make sure its production and use was under strict control of a responsible authority. In the August Statement, the words that were used most frequently were: Production, Destruction, Power, and History, but they reflected what actually happened during Nuclear Test Program. [Fig. 2] Though the U.S. government now had the power to destroy it enemies with just one bomb, the Test Program brought harm to the lives of the many innocent people of the Marshall Islands. The Nuclear Test Program also enabled the U.S. government to produce the most powerful nuclear test made in history, but this U.S. success also created a different history by those who were harmfully affected by it.

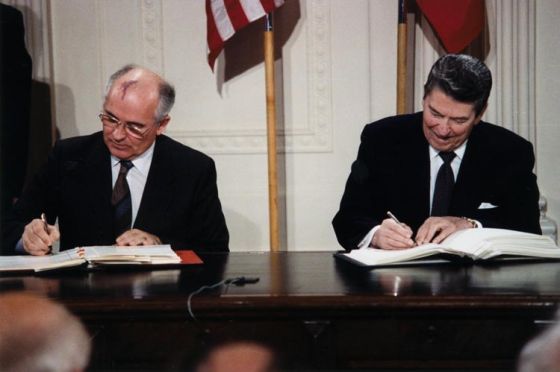
The U.S. Nuclear Test Program ran from 1946-1992, totaling to 1054 atmospheric and underground nuclear tests. [Fig. 3] 316 atmospheric test were completed from 1946-1963  (from 1963-1992, all nuclear tests conducted by the U.S. were done underground in accordance to the Atmospheric Test Ban Treaty signed with the USSR on Aug 5, 1963). The atmospheric nuclear tests were conducted in Nevada and the Pacific Proving Grounds (PPG), which is today part of the Republic of the Marshall Islands, from 1946-1958. (5) The PPG consisted of two atolls from the Marshall Islands: Enewetok Atoll and Bikini Atoll. [Fig. 4] The U.S. government chose these atolls as a location for the Program because of their isolation from big populations and from “shipping lanes, airways, and fishing grounds.” The Atolls were also chosen for their close distance to Kwajalein Atoll, which was a major U.S. airbase at the time. (4) Though the U.S. government found these atolls suitable for accomplishing their test program, its inhabitants were moved from their homes and taken atolls unsuitable to their way of life. The inhabitants of Enewetok Atoll were moved to Ujelang, a small atoll located south of Enewetok Atoll. The Enewetok people had to heavily rely on supply ships for food and other supplies, but the ships would come infrequently. An Enewetakian was quoted saying “Without canoes [and other materials] we cannot get to the other islands in the lagoon to harvest coconuts. Without the fishing equipment we cannot catch fish to get enough to eat.” The inhabitants of Bikini were moved to Rongerik Atoll, another small, uninhabited atoll located east of Bikini. Though a Navy official was quoted saying that Rongerik was more beautiful, richer, and larger than Bikini and that the coconuts were “three or four times as large as those on Bikini”, the exact opposite was true. The land of Rongerik was not fertile; it had fewer islands for food gathering and many of the lagoon fish were poisonous. (Dibblin, 22-23)


View Bikini Atoll in Operation Castle, 1954 in a larger map

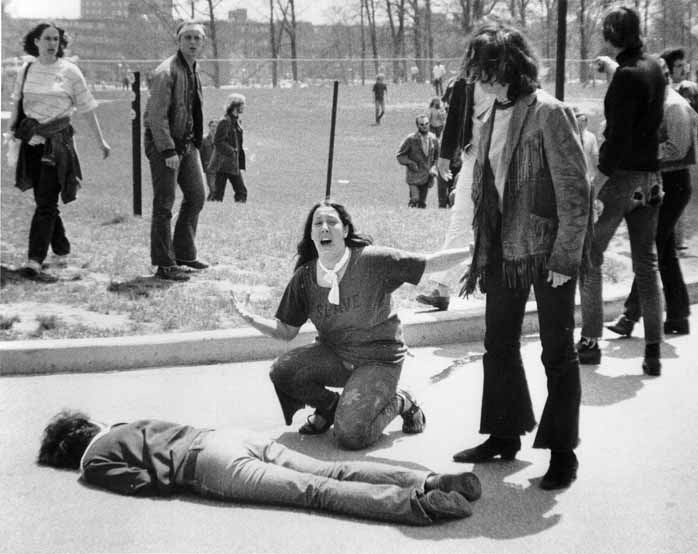
Out of the 67 tests conduct at the PPG, 1/3 of the tests were conducted on Bikini. (5,6) Bikini Atoll was the location of the first test series of the U.S. Nuclear Test Program, Operation Crossroads, where the nuclear bombs Able and Baker were detonated in 1946. (5) Bikini was also the location of some of the most powerful nuclear testing done by the United States. [Fig. 5] Operation Castle, a high-yield nuclear test series, was conducted in 1954 with Castle Bravo being the most powerful nuclear test conducted by the United States. Castle Bravo was a 15-megaton (15000 kiloton) nuclear test that was conducted near Namu Island in Bikini Atoll on March 1, 1954. The detonation was so powerful that it created a crater 6510 ft in diameter and 250 ft deep. (3) Within minutes, the detonation produced a mushroom cloud that rose over 100, 000 feet and promoted the spread of radioactive fallout across the Marshall Islands, and eventually, around the world. (Barker, 41) The atolls that were most effected by the fallout were Rongelap, Rongerik, and Utrik Atolls. (Barker, 42) [Fig. 6] People who were exposed to the radioactive fallout experienced itchy, burning skin, weakness, and hair loss. People also felt nauseated after eating food that was exposed to the fallout. (Dibblin, 25-27) The Castle Bravo test became the worst fallout disaster in U.S. history because the test conductors did not heed to the sudden change in weather patterns that would spread fallout to inhabited atolls. (Barker, 40) The inhabitants of these atolls were evacuated two days after the detonation. Due to the late evacuation, many people suffered through various health complications from radiation exposure, such as leukemia, tumors, and cancers. (Barker, 182-183)

Because of the U.S. government’s future ambitions for nuclear weapons in 1945, its choice in testing location, and its slow response to the Castle Bravo fallout over the Marshall Islands, the U.S. Nuclear Test Program caused more harm than good to the people of the Marshall Islands. The U.S government’s quest to discover the potential of nuclear weapons disregarded the health and well-being of the people who gave their land to the U.S. for testing purposes.


————-

Security and Preservation

To secure my project, I would keep it on secure database that would be protected with multiple passwords. The passwords would be long, using a combination of upper and lowercase letters, symbols, and numbers. I would make the database’s software was up-to-date and that it contained the latest software to detect viruses and malware. I would also secure my project by saving it on multiple databases in different locations, so that if one database is down or is caught with a virus, my project would be safe and intact on the other databases. To preserve my project for the next generation of historians, I would not only keep my project on multiple database, but also save my project on multiple storage mediums, such as flash drives, CD-ROMs, and DVD-ROMs. Having multiple copies of my project will ensure that it will be more likely to be found. Saving on multiple medium also decreases my chances of losing my project if one of the mediums becomes obsolete. Making sure that I am aware of the most latest storage mediums and transferring my project to new ones will ensure its preservation for years to come.

————-

References

(1) Statement by the President, August 6, 1945- Trinity Test Website

(2) Message to Congress on the Atomic Bomb- AtomicArchive.com

(3) Carey Sublette. “Operation Castle: 1954- Pacific Proving Ground.” The Nuclear Weapon Archive: A Guide to Nuclear Weapons. Last Modified 17 May 2006.

(4) Carey Sublette. “About the PPG.” The Nuclear Weapon Archive: A Guide to Nuclear Weapons. Last Modified 11 October 1997.

(5) Carey Sublette. “Gallery of U.S. Nuclear Tests.” The Nuclear Weapon Archive: A Guide to Nuclear Weapons. Last Modified 6 August 2001.

(6) “U.S. Nuclear Testing Program in the Marshall Islands.” Nuclear Claims Tribunal- Republic of the Marshall Islands. Last Modified 14 June 2007.

Barker, Holly. Bravo for the Marshallese: Regaining Control in a Post-Nuclear, Post-Colonial World. 2nd ed. Wadsworth Cengage Learning, 2013.

Dibblin, Jane. Day of To Suns: US Nuclear Testing and The Pacific Islanders. New York, NY: New Amsterdam Books, 1990.

AtomicCentral. Castle Bravo. Online Video. 1 min 20 secs. 7 Nov 2011.

Blockly Maze Solution

Here is my solution to the Blockly Maze:


Along with using logic commands, I used mostly left turn commands because the openings to new hallways would be to the left of the little-yellow-man. And if there was a wall ahead, the little-yellow-man would turn left until there was a all to the left of him so he can move forward. I enjoyed solving the maze and, as discussed in class today, found it was a lot like creating and displaying HTML code, except that you can instantly see your results and fix your mistakes easily. I just kept plugging in commands that worked and discarded commands that caused problems until I solved the maze.


Scratch: The Easy Animation Tool

After using Scratch for the first time, I found it to be an easy program to use to create computer animations.  Scratch gives the animator many preset commands for directing the animation in comparison to the program I usually use, Adobe ImageReady. ImageReady lets you animate using the layer system, in which each animation frame is layered on top of the other to create the animation. Much like animating with paper, the animator must draw on each new layer to create the animation and be mindful not to draw on a previous layer. Though the layer system is used on other Adobe programs like Photoshop and Illustrator, using layers to animate can become complicated as more layers are added.

Scratch is different because it lets you animate using commands, like in HTML code. Scratch lets the animator insert commands in the form of blocks that can dragged and stacked to create an animation. Scratch is unique as it lets the animator program one or multiple frames of animation (or, as in the program, sprite costumes) to move in any direction and even animate multiple sprites (objects or characters) on one screen. It would take many layers of animation frames to achieve this in ImageReady. The animator can also add sound, text, and interactive elements to make the animations more enjoyable to the user.

Though there are more dedicated animation programs out there, Scratch is very easy to use for those starting out in computer animation. The program contains many animation tools where their results would be difficult to reproduce in programs like ImageReady. And, more importantly, Scratch doesn’t have the $100 price tag like ImageReady and can be shared online in minutes.

Using stock sprites, I was able to create an animation of a flying bat, with speech bubbles (by pressing space bar) and music (by pressing the up key).

Digital Preservation: Futile?

After reading the article “Scarcity or Abundance? Preserving the Past in a Digital Era”, by Roy Rosenzweig, I felt that the preservation of our digital past (in the form of  web pages, photos, email messages, blog posts, etc) seems to be quite futile. In his article, Rosenzweig explains how difficult it is to preserve our digital past. Though Rosenzweig emphasizes that “the social, economic, legal, and organizational problems” are what makes digital preservation very challenging, he also points out that the ways we go about digital preservation can be problematic. Digital preservation seems like a futile endeavour due to the nature of technology. According to the Library of Congress’  website on Personal Archiving , technology has a short lifespan and is constantly changing. Most technology changes for the good, like increased speed, memory, or ease of use. But in terms of digital preservation, changes in technology can be bad, like for hardware, software, file types, and accessibility.

Despite these hindrances, Rosenzweig does mention some possible solutions to the digital preservation problem:

1)      Preserving old technology so the original data can be accessed

2)      Migrate or convert data so it can be accessed on newer technology

3)      Use an emulator it access data (where older data can be accessed on newer technology that acts like older technology)


Unfortunately, Rosenzweig did find some troubles with these preservation techniques:

  • Preserving old technology can come at a cost if it becomes broken and has no replacement parts
  • There is a risk for data corruption with migration or loss in quality when converting data to new technology
  • Depending on how well it is made, there is a chance for emulators to not be able to access the data exactly like the original

Though these techniques may seem unreliable to use in preserving our digital past, they are currently some of the best ways to help keep our digital past alive. I don’t know if this was considered before, but has it been thought to create a file type or system that can be backwards-compatible with existing and future technology? Why convert or migrate old data to work on new technology, and not just make new technology compatible to a standardize file type or system that old data can be accessed on? Similar to how bitmap and midi files can still be accessed by newer technology today, I can imagine a standardize file type/system created solely for the preservation of data that can be accessed by current and future technologies. I understand that a lot of funding and research may be needed for this to become possible, but having the ability to access data from our past on one file type outweighs having to put data at risk of corruption  by migrating or converting it on new technology every few years or so.

With this said, I do not see digital preservation as a futile endeavour. With our digital past still at a young age, it will only be a matter of time before we find the best way to preserve our digital past for future generations.

Other Uses for Ngram Viewer

Now that I know that word usage can correlate with the events of the past, I went back to Google’s Ngram Viewer to determine if its results can help me focus the topic of my final project. My final project will be about the atmospheric nuclear test programs conducted by the United State during the Cold War. But since these programs were conducted over decades, and in a variety of locations and conditions, it would be sensible to narrow down the topic in order for me to create a sound argument.  I decided to use the words “nuclear tests” and “nuclear testing” to see where they place on the chart to help determine where to narrow down my research. I will then use the results to help me find a time frame to work in and determine what information to look for in my sources.

According to Ngram Viewer, I might want to try to focus my project between the years of 1956-1965. Since word usage can correlate with historical events, I believe that the increase of the usage of these words showed that the United States was performing many nuclear tests during this time. I find that this would be a good time frame to use to obtain information for my research. Ngram Viewer also showed that I could look specific information to aid in my research. Since the usage of these words occurred the most between 1956-1965, I can create my argument based on sources that focus on the programs and events in that time period. I will have a stronger argument using sources that that have information on the programs of the 1960’s.

Historical Events and Word Usage

Using Google’s Ngram Viewer, one can see how words were used in literature overtime. Since I am currently learning about the atmospheric nuclear testing conducted by the United States, I decided to use the words “atomic” and “nuclear” in the Ngram Viewer to see if one was used more often. “Atomic” is an older word, its use dating back to 1670, and was more likely to be used literature before 1959 when its use starts to decline. After 1959, the word “nuclear” (1846) would become the more popular word to describe these weapons. (1) With the Ngram Viewer, I was also able to find that the usage of these words correlated with historical events that happened between the United States and the Soviet Union in dealing with such weapons.

(2)

According to the Ngram Viewer, the usage of the word “atomic” begins to decline significantly after 1960 and the word “nuclear” became used more often to describe these new weapons. The usage of “nuclear” may have increased due to the discovery and fear of the Soviet tactical nuclear weapons planted in Cuba, which sets of the Cuban Missile Crisis in late 1962. Also, nuclear weapon testing was well underway during this time, which raised concerns about the health and safety of people and the environment.

(3)

In 1970, the Ngram Viewer showed that both “atomic” and “nuclear” dropped in usage. I found that there was more focus on the events of the Vietnam War than on nuclear weapons. Students were killed at Kent State University and Jackson State College in May while protesting the war.

(4)

While the usage of the word “atomic” continued to decline, the usage of “nuclear” increased the most in 1987. That year, there were talks about the reduction of nuclear weapons between the United States and the Soviet Union. There were also talks of starting the next START treaty, which would reduce the amount of nuclear weapons each held. After 1987, the word’s usage steadily decreased. The arms treaty and the break up of the Soviet Union in 1989 helped quell the long fear of nuclear war. In conclusion, Ngram Viewer is very useful to show how word usage correlates with historical events.

—-

(ref) Cold War Timeline

(1) Etymonline.com

(2) http://library.thinkquest.org/11046/days/index.html

(3) http://life-in-boston.blogspot.com/2010/04/kent-state-shootings.html

(4) http://krepon.armscontrolwonk.com/archive/2780/echoes-of-a-treaty-ratification-past

The nuclear bombing of Hiroshima and Nagasaki greatly contributed to the United States’ victory in World War II. What also contributed to America’s victory was a test that occurred that month before the bombing of Japan. The Trinity Test, the detonation of the world’s first nuclear weapon, paved the way for the creation and success of the two nuclear bombs dropped on Japan and for future nuclear weapons testing. But the important factor for the success of the Trinity Test was the location where the test took place. Finding the proper test location was important for the people conducting the test for the quality and success of the test and for the US’s overall victory against the Japanese.

The Manhattan Project, a group of scientists and military professionals who conducting in the research and development of nuclear weapons, wanted to ensure the quality and safety of the Trinity Test. The team took many precautions for the selection of the test location.

The location the Manhattan Project desired to meet certain requirements for the test location, like its “availability, distance from Los Alamos (the headquarters for the Manhattan Project), good weather, few or no settlements, and that no Indian land would be used.”

Despite considering test locations in California, Colorado, and Texas, it was decided that the Trinity Test would be conducted in New Mexico, at the then-called Alamogordo Bombing and Gunnery Range. The range was located in a desert called the Jornada del Muerto.


This location ensured the quality of test as it was controlled by the military, had good weather to prevent the possible spread of fallout during the test, and was about 200 miles from the Manhattan Project Headquarters in Los Alamos, NM.

——

References

(1) Carey Sublette. “The Manhattan Project (and Before)”. The Nuclear Weapon Archive: A Guide to Nuclear Weapons. Last Modified 30 March 1999.

(2) U.S. Department of Energy. “Trinity Site”. Trinity Atomic Website. 2005.

(3) Atomic Archive

Photo References

Title Slide

Slide One

Slide Two

Slide Three

From a young age, we were taught how to use certain computer programs, like word processors (Word, WordPerfect, etc), to get acquainted with how they work and to learn to use them better in the future. I have first learned to use one program, a slideshow program call PowerPoint, in middle school and have used it during my time in college. Even my little brother has used it for a 4th Grade project. Overtime, I have found that PowerPoint is good for teaching us to put information in order and to present our work in within a specific timeframe. But I have learned that are some things that PowerPoint is not god at teaching us. Edward Tufte, the author of the article PowerPoint is Evil, argues that PowerPoint became a substitute for our presentations, and does little to gain input from the audience or to preserve the value of its content. (1) While I looked further into Tufte’s argument, I used The Gettysburg PowerPoint Presentation provide examples of the problems Tufte describes in his article.

Tufte described how PowerPoint didn’t provide ways for the speaker to connect to his/her audience. Because of this, PowerPoint becomes more like a visual aid, where it just displays information rather than help to explain it. The audience doesn’t gain much from the PowerPoint unless the speaker uses it to explain certain details of the presentation. The Gettysburg.ppt is an example of this as it displays parts of the Gettysburg Address, out of its original context. The presentation would be very hard to understand for people who have never read the Gettysburg Address. The presentation just lists words and phrases from the speech and makes no connection to the speech until the end.

Tufte also described the problem of how the PowerPoint format weakens the content of a presentation. Because information is split into individual slides, it makes it difficult for the audience to understand how the information ties together. PowerPoint also limits how much information you can put onto a slide. Too much information can overwhelm the slide and too little information will make the presentation incoherent.  An example of these problems can also be seen in the Gettysburg.ppt. When split into individual slides, the Gettysburg Address became incoherent and was hard to see how the information on the slides connected to each other without knowing the context. The presentation also drastically simplified the speech and looses its original meaning.

A solution for these problems would be for the speaker to explain, or recite, the Gettysburg Address before the start of the presentation so the audience will understand the context. The speaker could also explain each slide in relation the Gettysburg Address and inquire the audience for questions during the presentation to make sure they understand.

—–

(1) Tufte, Edward. PowerPoint is Evil. Sept 2003. Wired.com. Accessed 3 Nov 2012

I created my historical chart based on the information I found in a book on my family’s bookself. The book was called, Historical Records- World War II: Service Record Book of Men and Women of Bath County, Virginia. It was produced by the Coleman-Brinkley Post of the V.F.W. No. 4202, located in Hot Springs, VA.(1) The book contained pictures and lists of the men and women from Bath Co. who served in WWII. But what caught my eye was the information on the county’s Civilian Defense Council. Established in February 1940 by the governor of Virginia, the purpose of the Civilian Defense Council was to “provide a protective force” against the enemy (Nazi-Germany, Japan, etc) and to sponsor programs “designed to inform the people as to their proper function in times of national stress”.

The council was run by civilians from all around the county. Here, I have created my chart based on the different jobs people performed in the Civilian Defense Council:
Civilian Efforts in World War II- Bath County, VA
I decided to use a pie chart to present the data, as one could see and compare the kinds of jobs people performed in the Council. Unfortunately, the book was vague on what the numbers actually meant. Is the data showing how many people performed each job? Is it showing which jobs were more favorable by the people or the amount of people needed for the job to function? Despite this problem, the chart does show there was a large amount of people who worked as Air Raid Wardens or in the Civilian Police. I assume these jobs were valuable to the Council and considered important to the safety of the county in comparison to the other jobs.


——–

(1) V.F.W- Veterans of Foreign Wars

Feltron gathered a wide range of data to create his Feltron Reports. The reports were furnished with data he collected from his everyday life and each set of data was presented by visualizations, such as lists, graphs, or charts. Feltron also wanted to use such visualizations to have “the simplest way to communicate the data” he has gathered. (1) Basically, Feltron wanted to present his data in the simplest form first and to show the details later. After viewing the Feltron Reports, I was able to find that Feltron improved the visualizations he used over the years to present his data in the simplest form. An example of these improvements occurred in the reports from 2005-2007.

Snapshot of the Feltron Report website as of Oct 2012

Snapshot of the Feltron Report website as of Oct 2012

One improvement in the reports from 2005-2007 was how the data for the “most played music artists” was presented. In 2005, the data was represented in a list form, while in 2006 and 2007 the data was represented in a pie chart. Though it may not be as easy as reading the list, the pie chart was an improvement of the list because it was able to show a comparison of how much each artist was played during the year.

Another visualization improvement was how the books and magazines Feltron read were presented. For books read, it was presented as a list in the 2005 and 2006 reports. In 2007, the visualization is simplified by using a number to represent the data on books read. This was an improvement as it then become easier for one to see a number than a list of book names to know how many were read.

One more improvement in the reports was the presentation of data for the photographs Feltron took based on location. The 2005 report used a traditional bar graph to present the data, while the 2006 and 2007 reports used a variation of the side bar graph. I found this to be an improvement as the side bar was able to clearly present the data from multiple locations on one bar (rather than on multiple bars in a traditional bar graph).

So, over the years Feltron was able to simplify the visualizations he used to present his data. The simpler visualizations helped him communicate his data quicker, easier, and help compliment the overall design of the reports.

——-

(1) http://feltron.com/faq.html

Older Posts »